How do I debug my Java applets to see what's going wrong?
Often, when an applet behaves strangely or fails to work, the problem is hard to diagnose. Many applets behave fine under Netscape Navigator, only to fail under Internet Explorer (or vice versa). Sometimes a different Java Virtual Machine (JVM) will have less tolerance for a bug, and other times the fault lies in the actual JVM implementation.
The lack of information provided by the browser can be frustrating. However, there is a way to display a debugging console, which will provide developers with additional information. For example, an uncaught exception will generate an exception trace, telling you which method and which exception were involved. Both the later versions of Netscape Communicator and Internet Explorer support these debugging consoles.
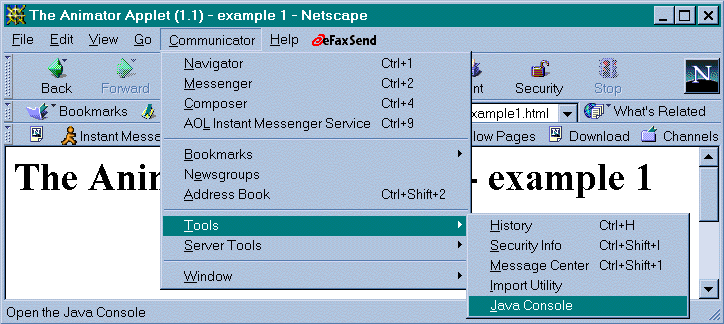
Load any page with an applet, and then select the following menu option
Communicator -> Tools -> Java Console
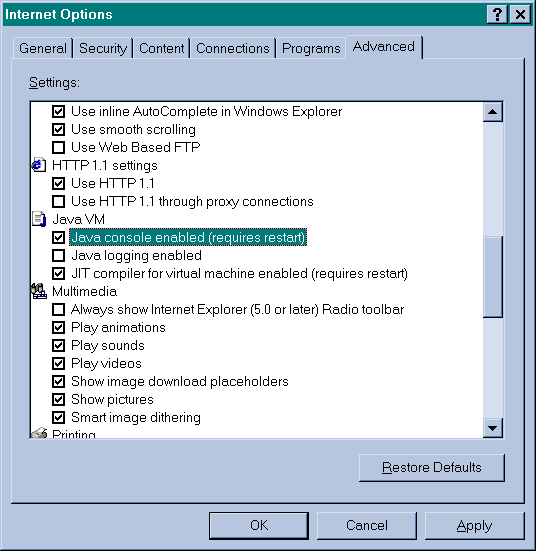
First, you must ensure that the Java console is enabled. Make sure that the
Tools -> Options -> Advanced -> Java Console Enabled checkbox is
checked.
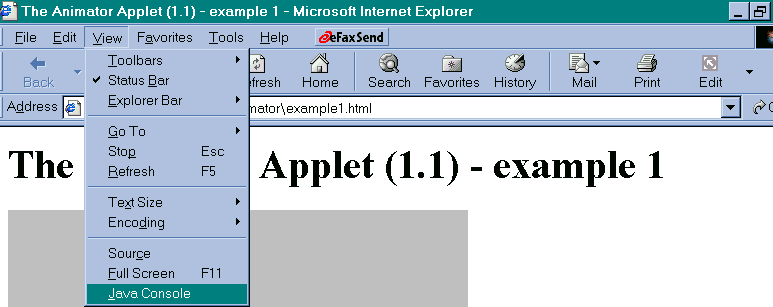
Next, load any page with an applet, and then select the following menu option
View -> Java Console
Both of these consoles provide useful debugging information, which can assist developers in tracking down that pesky bug.